
STATISTICAL FUNCTIONS IN EXCEL
30, Dec 2017
STATISTICAL FUNCTIONS IN EXCEL
People usually have love-hate relationship with statistics. When you get your formulas right you are in love with it and when your answers go wrong, your feelings take the opposite route. But when you are working on statistics in Excel, things are simpler and less complicated. So today, we bring to you the most used statistical functions of Excel.There are different ways, one can use, excel’s statistical functions, let us look at them
- Statistical functions help in analyzing the data by providing insights about its characteristics such as average, variability, and distribution.
- It helps in summarizing large datasets into meaningful metrics, this makes it easier to understand and interpret the information.
- Based on data trends and patterns, these functions help in informed decision-making with the application of statistical measures like averages, standard deviations, and correlations.
- The quality control aspect is maintained by identifying outliers, detecting trends, and assessing the consistency of data.
- With the help of historical data, statistical functions help in creating forecasts and predictions, which ultimately helps in planning and decision-making.
- The best point about its application is that it helps you to compare different datasets and bring out their similarities, differences, and relationships.
- The ultimate advantage is its conjunction with Excel’s charting tool, it helps to create visual representations of data, which enhances understanding and communication for the stakeholders involved.
Want to know more: Click here!
We believe that Excel’s statistical functions provide all the tools required for any financial staff member to study, analyze, and interpret data. ultimately assisting in improved decision-making and comprehension of underlying patterns and trends.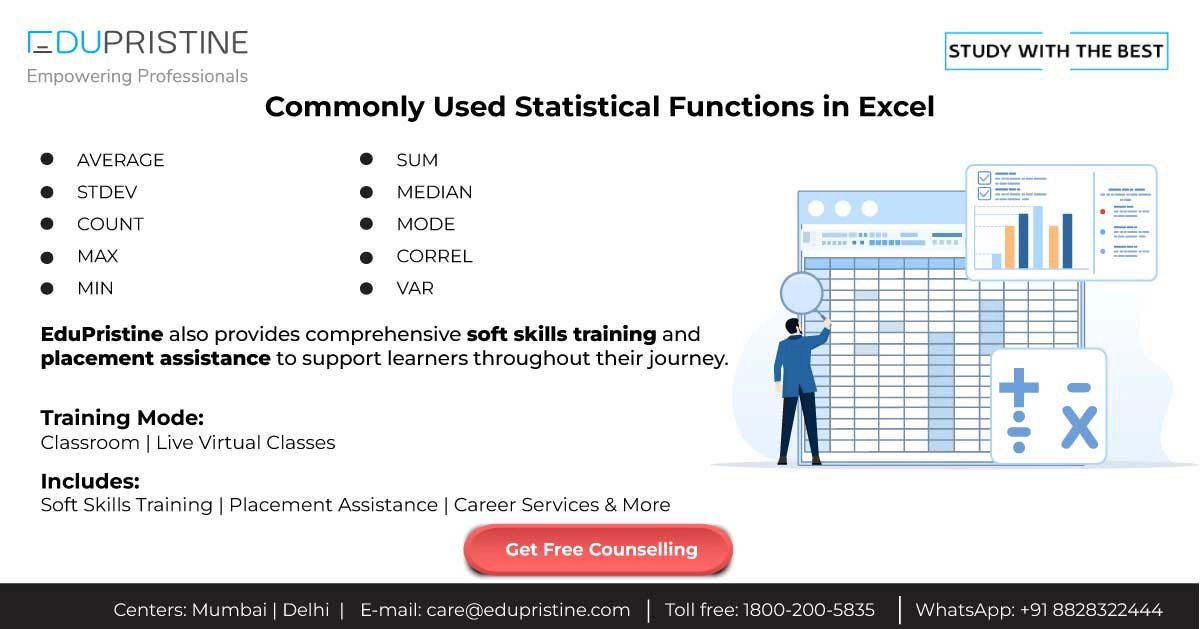
Let’s go through some of the commonly used statistical functions:
1. AVERAGE
The average function simply adds up all those numbers and then divides the total by how many numbers there are. It gives you a typical or central value of your data.- Syntax AVERAGE(number1, [number2], …)
- Description: Calculates the arithmetic mean (average) of a range of numbers.
- Example =AVERAGE(A1:A10) will return the average of numbers in cells A1 through A10.
2. STDEV
This function measures how spread out your numbers are from the average. If the numbers are all close together, the standard deviation is small. If they are more spread out, the standard deviation is larger.- Syntax STDEV(number1, [number2], …)
- Description: Calculates the standard deviation, a measure of the amount of variation or dispersion in a set of values.
- Example =STDEV(B1:B10) will return the standard deviation of numbers in cells B1 through B10.
3. COUNT
In Excel, it counts how many cells in a range have numbers in them.- Syntax: COUNT(value1, [value2], …)
- Description: Counts the number of cells in a range that contain numbers.
- Example: =COUNT(C1:C10) will count the number of non-empty cells in the range C1 through C10.
4. MAX
If you have a bunch of numbers, the MAX function tells you which one is the biggest.- Syntax MAX(number1, [number2], …)
- Description: Returns the largest value in a set of values.
- Example =MAX(D1:D10) will return the maximum value from cells D1 through D10.
5. MIN
On the other hand, MIN does the opposite of MAX. It tells you which number is the smallest in your group.- Syntax MIN(number1, [number2], …)
- Description: Returns the smallest value in a set of values.
- Example =MIN(E1:E10) will return the minimum value from cells E1 through E10.
6. SUM
Similar to COUNT, but instead of just counting the numbers, SUM adds them all up.- Syntax SUM(number1, [number2], …)
- Description: Adds up all the numbers in a range.
- Example =SUM(F1:F10) will add all the numbers in cells F1 through F10.
7. MEDIAN
It’s the number that splits your data into two equal halves.- Syntax MEDIAN(number1, [number2], …)
- Description: Returns the median, which is the middle value in a set of numbers.
- Example =MEDIAN(G1:G10) will return the median of numbers in cells G1 through G10.
8. MODE
If you have a list of numbers, the mode is simply the number that appears most frequently.- Syntax MODE(number1, [number2], …)
- Description: Returns the most frequently occurring value in a range of values.
- Example =MODE(H1:H10) will return the mode of numbers in cells H1 through H10.
9. CORREL
This function tells you how closely related two sets of numbers are to each other.- Syntax: CORREL(array1, array2)
- Description: Calculates the correlation coefficient between two sets of data.
- Example =CORREL(I1:I10, J1:J10) will return the correlation coefficient between the values in cells I1 through I10 and J1 through J10.
10. VAR
It calculates the variance which is a measure of the dispersion of a set of values around their mean.- Syntax VAR(number1, [number2], …)
- Description: Calculates the variance, a measure of the dispersion of a set of values around their mean.
- Example =VAR(K1:K10) will return the variance of numbers in cells K1 through K10.
Did you find this blog post helpful? Let us know in the comments!
But that’s not all—we’re excited to introduce EduPristine’s financial modeling course, a must-do program for all aspiring finance professionals.Wondering how Excel is used in the Financial Modeling course?
Financial modeling is essential for understanding and analyzing a business’s fundamentals, which supports decision-making. Normally built in Excel these models allow for elaborate examination and forecasting of business scenarios. This helps in offering valuable insights for informed decision making.
Here’s why EduPristine should be your go-to for training
Here is why EduPristine should be your go-to partner for your training needs:- Industry Recognition:Our course is co-certified with BSE Institute and it provides you with valuable industry recognition.
- Proven Success: With over 15 years of success we have trained more than 70,000 students and delivered over 6 million hours of training.
- Expert Faculty:Learn from qualified instructors with 15 years of expertise in financial concepts.
- Commitment to Success: Beyond mastering Excel, our course includes Power BI training, a crucial skill in today’s data-driven world. Plus you’ll get mentorship, career support, soft skills training, and 7-day support.
- Flexible Learning Options: Choose from in-person classes in Mumbai and Delhi or live virtual sessions at convenient times, making it easy to fit learning into your schedule.
Want to know more: Click here!
So, why wait? Take the first step towards a successful career in finance with EduPristine’s financial modeling course in India. If you find this article helpful, consider sharing it with your friends and colleagues.MAKE YOUR CAREER IN
Need more Info?
Tags
- ABOUT CFA COURSE
- ABOUT FRM COURSE IN INDIA
- ABOUT THE US CPA COURSE
- ACCA
- ACCA CERTIFICATION
- ACCA COURSE
- ACCA COURSE DETAILS
- ACCA COURSE DURATION
- ACCA COURSE ELIGIBILITY
- ACCA COURSE ELIGIBILITY CRITERIA
- ACCA COURSE ELIGIBILITY IN INDIA
- ACCA COURSE FEES
- ACCA COURSE FEES IN INDIA
- ACCA COURSE IN INDIA
- ACCA COURSE STRUCTURE
- ACCA COURSE STRUCTURE AND FEES IN INDIA
- ACCA COURSE SUBJECTS
- ACCA COURSE SYLLABUS
- ACCA EXAM STRUCTURE AND PATTERN
- ADMISSION TO CFA
- AI-POWERED FRAUD DETECTION IN ACCOUNTING
- APPLICATIONS OF AI IN ACCOUNTING
- AUDITING AND COMPLIANCE
- AUTOMATED DATA ENTRY
- AUTOMATED DATA ENTRY AND PROCESSING
- BAT COURSE
- BEST FINANCIAL MODELING COURSE
- BEST FINANCIAL MODELING COURSE IN INDIA
- BEST ONLINE CFA PREP COURSE
- BEST ONLINE FINANCIAL MODELING COURSE
- CAREER OPPORTUNITIES FOR CPA
- CERTIFICATION
- CERTIFIED FINANCIAL PLANNER (CFP®) COURSE
- CERTIFIED FINANCIAL PLANNER®
- CERTIFIED FINANCIAL PLANNER® PROGRAM
- CFA
- CFA CERTIFICATION
- CFA COURSE
- CFA COURSE CURRICULUM
- CFA COURSE DETAILS
- CFA COURSE DURATION
- CFA COURSE FEES
- CFA COURSE FEES IN INDIA
- CFA COURSE FULL DETAILS
- CFA COURSE IN INDIA
- CFA COURSE IN INDIA CFA COURSE CFA COURSE DETAILS CFA COURSE SUBJECTS
- CFA COURSE SUBJECTS
- CFA COURSE SYLLABUS
- CFA COURSE TRAINING
- CFA CURRICULUM
- CFA FOUNDATION COURSE
- CFP CERTIFICATION
- CFP COURSE
- CFP COURSE DETAILS
- CFP COURSE FEE
- CFP COURSE FEES IN INDIA
- CFP EXAM
- CFP® COURSE FEES
- CFP® COURSE SYLLABUS
- CFP® ELIGIBILITY
- CMA COURSE
- CMA COURSE DETAILS
- CMA COURSE DETAILS IN INDIA
- CMA COURSE DURATION.
- CMA COURSE ELIGIBILITY
- CMA COURSE ELIGIBILTY
- CMA COURSE FEES
- CMA COURSE FULL DETAILS
- CMA COURSE IN BANGALORE
- CMA COURSE IN INDIA
- CMA COURSE SUBJECTS
- CMA COURSE SYLLABUS
- CMA ONLINE COURSE
- CPA ACCOUNTANT
- CPA COURSE
- CPA COURSE DETAILS
- CPA COURSE DURATION
- CPA COURSE ELIGIBILITY
- CPA COURSE FEES
- CPA COURSE FEES IN INDIA
- CPA COURSE IN INDIA
- CPA COURSE STRUCTURE
- CPA COURSE SYLLABUS
- CPA EXAM
- EVOLUTION OF AI IN ACCOUNTING
- EVOLUTION OF AI IN FINANCE
- FINANCIAL MODELING
- FINANCIAL MODELING AND VALUATION
- FINANCIAL MODELING AND VALUATION COURSE
- FINANCIAL MODELING COURSE
- FINANCIAL MODELING COURSE CURRICULUM
- FINANCIAL MODELING COURSE DETAILS
- FINANCIAL MODELING COURSE FEE
- FINANCIAL MODELING COURSE IN INDIA
- FINANCIAL MODELING COURSE USEFUL
- FINANCIAL MODELING COURSE WITH PLACEMENT
- FINANCIAL MODELLING COURSE
- FINANCIAL MODELLING COURSE DURATION
- FINANCIAL MODELLING COURSE FEES
- FINANCIAL MODELLING COURSE ONLINE
- FINANCIAL RISK MANAGER
- FM COURSE & FRM® COURSE
- FRM
- FRM COURSE
- FRM COURSE CERTIFICATION
- FRM COURSE CURRICULUM
- FRM COURSE DETAILS
- FRM COURSE DURATION
- FRM COURSE ELIGIBILITY
- FRM COURSE FEES
- FRM COURSE IN INDIA
- FRM COURSE SYLLABUS
- FRM® COURSE SUBJECTS
- FRM® COURSE SYLLABUS & HOW TO APPLY FOR FRM® COURSE
- IN FINANCE
- PG PROGRAM IN BUSINESS ACCOUNTING & TAXATION
- PGP BAT COURSE FEES
- PGP BAT COURSE SALARY IN INDIA
- PGP-BAT COURSE
- PGP-BAT COURSE COURSE IN INDIA
- PGP-BAT COURSE DETAILS
- PGP-BAT COURSE DURATION
- PGP-BAT COURSE ELIGIBILITY
- PGP-BAT COURSE FULL FORM
- PGP-BAT COURSE IN INDIA
- PGP-BAT COURSE INSTITUTE IN INDIA
- PGP-BAT COURSE SYLLABUS
- PLACEMENTS TO CFA
- SOFT SKILLS
- TAX PREPARATION
- TAX PREPARATION AND PLANNING
- US CMA COURSE
- US CMA COURSE DETAILS
- US CMA PREPARATION
- US CPA COURSE
- US CPA COURSE DETAILS
- US CPA COURSE FEES
- US CPA COURSE FULL FORM
- US CPA COURSE TRAINING
- US CPA EXAMS
- US CPA MEANING
- US-CMA
- US-CPA
- WHAT IS ACCA COURSE
- WHAT IS CFP® CERTIFICATION?
- WHAT IS CMA COURSE
- WHAT IS CPA COURSE
- WHAT IS FINANCIAL MODELING ALL ABOUT
- WHAT IS FINANCIAL MODELING COURSE
- WHAT IS FRM® COURSE? FRM® COURSE DETAILS
- WHAT IS FRM® COURSE? FRM® COURSE REVIEW
- WHAT IS THE CPA COURSE
- WHAT IS US CPA COURSE?
- WHAT IS US-CMA COURSE
related blogs

17, Dec 2024
Will CMA Online Classes Help You Pass the CMA Exam
Hello, and welcome back to our new blog. Are you preparing to take on the Certified Management Accountant (CMA) journey Read More
16, Dec 2024
Key Insights for CFP® professionals from the 2024 Financial Planning Conclave.
Hello, and welcome back to our new blog. As the financial world continues to evolve, the need for qualified and Read More
04, Dec 2024
What You’ll Learn in Financial Planning Education
CFP® Course Curriculum: What You’ll Learn in Financial Planning Education | EduPristine Welcome back learners to another blog post focusing Read More
18, Nov 2024
Capital Investment Decision in CFA®
Capital Investment Decision in CFA® | EduPristine Welcome back, learners, to another insightful blog post on Capital Investment Decisions in Read More16, Nov 2024
– Izkušnje in strategije za športno stave v Liraspin casino
Izkusite Liraspin casino: Strategije za športno stave Športno stave so priljubljen način, kako obogatiti svoje športne izkušnje. V svetu, kjer Read More16, Nov 2024
Strategie e consigli per le scommesse sportive fantasy su Liraspin
Navigare il mondo delle scommesse sportive fantasy con Liraspin Il mondo delle scommesse sportive fantasy sta guadagnando sempre più popolarità, Read More16, Nov 2024
Strategien für Fantasy-Sportwetten: Ein Leitfaden von Liraspin
Navigieren im Bereich Fantasy-Sportwetten mit Liraspin Fantasy-Sportwetten haben in den letzten Jahren an Popularität gewonnen. Ob Sie ein erfahrener Spieler Read More
14, Nov 2024
Techniques Used by CFP Practitioners to Enhance Client Wealth.
Techniques Used by CFP® Practitioners to Enhance Client Wealth | EduPristine Welcome back, financial planning learners! Today’s blog will shed Read More
13, Nov 2024
How to Become a CPA Without a Degree in Accounting.
Hello, and welcome back to our latest blog. Have you ever wondered if you could become a Certified Public Accountant Read More
12, Nov 2024
How Critical is the Role of CFOs in Mergers and Acquisitions
How Critical is the Role of CFOs in Mergers and Acquisitions? Hello, and welcome back to our new blog. In Read More
23, Oct 2024
The Role of Artificial Intelligence in Accounting and Finance | EduPristine
The Role of Artificial Intelligence in Accounting and Finance | EduPristine Welcome back, learners, to another blog post on the Read More
21, Oct 2024
Role Of CFP® In Bridging the Financial Literacy Gap in India | EduPristine
Role Of CFP® In Bridging the Financial Literacy Gap in India | EduPristine Welcome back, readers, to another insightful blog Read More
01, Oct 2024
A Day in The Life of a Financial Risk Manager ® (FRM®) | EduPristine
A Day in The Life of a Financial Risk Manager ® (FRM ®) | EduPristine Welcome back, readers, to another Read More
30, Sep 2024
How Much Does an US CMA Professional Earn in India by EduPristine
How Much Does a US CMA Professional Earn in India? Hello, and welcome back to our new blog. Have you Read More
27, Sep 2024
Advancing Your Career with a Certified Financial Planner (CFP®) Course | EduPristine
Advancing Your Career with a Certified Financial Planner (CFP®) Course | EduPristine Welcome back learners to another blog post on Read More
26, Sep 2024
US CMA Certification: Helps You Transition into Management Roles
How the US CMA Certification Can Help You Transition into Management Roles? Hello, and welcome back to our new blog. Read More
23, Sep 2024
How the CPA Course Opens Doors to Global Success by EduPristine
How the CPA Course Opens Doors to Global Success? Welcome to our latest blog! Ever wondered what it takes to Read More
21, Sep 2024
Why is Internal Control Crucial for US CMAs | EduPristine
Why is Internal Control Crucial for US CMAs? Hey there, welcome back to our new blog. Have you ever wondered Read More
20, Sep 2024
How Much Does an ACCA Professional Earn in India by EduPristine
How Much Does an ACCA Professional Earn in India? Hey there, so good to have you back again. Have you Read More
18, Sep 2024
PGP-BAT Course Career Opportunities Guide by EduPristine
PGP-BAT Course Career Opportunities | EduPristine Welcome back, learners, to another blog post on the career options ahead of you Read More
16, Sep 2024
The Power of Soft Skills in Financial Leadership (Part I) EduPristine
CFA, FM, and FRM: The Power of Soft Skills in Financial Leadership (Part I) | EduPristine Welcome back, learners, to Read More
14, Sep 2024
How much is a US CPA professional entitled to earn in India?
How much is a US CPA professional entitled to earn in India? Ever thought how your earning potential would skyrocket Read More
13, Sep 2024
The Essentials of Treasury & Liquidity Risk Management in FRM® Course
The Essentials of Treasury and Liquidity Risk Management in FRM® Course | EduPristine Welcome back, learners, to another insightful blog Read More
12, Sep 2024
CMA Course: Unlocking Diverse Career Paths | EduPristine
CMA Course: Unlocking Diverse Career Paths | EduPristine Welcome back, learners, to another blog post on the career paths after Read More
11, Sep 2024
SBI’s Wealth Management: A Growth Prospects for CFP Certified Experts.
How SBI's Wealth Management Creates Opportunities for CFP® - Certified Experts? Hello, and welcome back to our new blog. Have Read More
06, Sep 2024
Can You Get into the Big 4 with the ACCA Qualification?
Can You Get into the Big 4 with the ACCA Qualification? Hi, great to have you back again. One of Read More
04, Sep 2024
CPA License in India- A Game-Changer for Your Accounting Career
Why Earning a CPA License in India is a Game-Changer for Your Accounting Career Hello, so good to have you Read More
03, Sep 2024
Understanding Payroll and Its Components by EduPristine
Understanding Payroll and Its Components by EduPristine Hello there, and welcome back to our latest blog post. Do you have Read More
02, Sep 2024
Safeguarding Success: Tackling Operational Risk in FRM® Course | EduPristine
Safeguarding Success: Tackling Operational Risk in FRM® Course | EduPristine Welcome back, learners, to another insightful blog post on Operational Read More
31, Aug 2024
US CPA Course: Unlocking Diverse Career Paths | EduPristine
The US CPA Course : Unlocking Diverse Career Paths | EduPristine Welcome back, learners, to another blog post on the Read More
31, Aug 2024
Understanding Market Risk within FRM® Course EduPristine
The Pulse of the Market: Understanding Market Risk within FRM® Course Welcome back learners! In this blog post we are Read More
24, Aug 2024
Financial Modelling Course Opportunities | EduPristine
Financial Modelling Course Opportunities by EduPristine Welcome back, learners! In this blog post, we'll explore how completing the financial modelling Read More
23, Aug 2024
Is the ACCA Course Suitable for Working Professionals in India
Is the ACCA Course Suitable for Working Professionals in India? Hello again, and a very warm welcome to our new Read More
17, Aug 2024
Which Path to Take- US CPA vs. Canada CPA?
Which Path to Take- US CPA vs. Canada CPA? Hello, and welcome back to our new blog. Have you ever Read More
13, Aug 2024
Why Should BCom Graduates and Those with 0-2 Years of Experience Pursue the PGP-BAT Course at Edu Pristine
Why Should B.Com Graduates and Those with 0-2 Years of Experience Pursue the PGP-BAT Course at EduPristine? Hi, and welcome Read More
05, Aug 2024
Why the ACCA Qualification is Gaining Popularity in India by EduPristine
Why the ACCA Qualification is Gaining Popularity in India? Hello and welcome back! Have you noticed the number of professionals Read More
31, Jul 2024
ACA vs ACCA What’s the Difference? A guide by Edupristine
Associate Chartered Accountant (ACA) vs Associate of Chartered Certified Accountants (ACCA) Hey there, so good to have you back again. Read More
31, Jul 2024
Ethical Decision Making in Financial Management | Edupristine
Ethical Decision Making in Financial Management Introduction The swift moving world of finance has the ability to have lasting influences Read More
31, Jul 2024
Understanding the Time Value of Money – TVM
What is (TVM) Time Value of Money? The Time Value of Money (TVM) is a fundamental financial principle which asserts Read More
30, Jul 2024
Guide on How to Study for the US CMA Exams | US CMA Course Full Details
Tips & Tricks to Study for the US CMA Exams? Hello, and welcome back to our new blog! We have Read More
30, Jul 2024
CMA Advantages: Benefits of Classroom Training | CMA COURSE | EDUPRISTINE
Why EduPristine's Classroom Training Gives Students a Leading Advantage for CMA COURSE? It is so good to see you again. Read More
18, Jul 2024
Guide to choose an Institute for US CMA program | EduPristine
How to choose an institute for the US-CMA program? Hello, and how have you been? Welcome back! If you have Read More
16, Jul 2024
Core Differences: US CMA vs. Indian CMA
Indian CMA vs US CMA Hello, and welcome back to our new blog where we will be discussing the Indian Read More
11, Jul 2024
The Critical Importance of Soft Skills for CPAs
The Critical Importance of Soft Skills for Certified Public Accountants Hello, and welcome back to our new blog. Have you Read More
09, Jul 2024
Essential Soft Skills for CMAs | US CMA COURSE
Essential Soft Skills for CMAs | US CMA COURSE Hello, and welcome back to our new blog. Have you ever Read More
08, Jul 2024
Guide to Expected Shortfall (ES) by EduPristine
What is Expected Shortfall (ES)? Expected Shortfall (ES) is a way to measure the risk of an investment portfolio focusing Read More
06, Jul 2024
Guide to Choose an Institute for the ACCA Course
How to Choose an Institute for the ACCA course? Hi, so good to have you back again. If you have Read More
05, Jul 2024
BEST INSTITUTE FOR US CPA COURSE IN INDIA | EDUPRISTINE
Hello, and welcome back to our new blog. If you have already decided to pursue the most prestigious US CPA Read More
05, Jul 2024
Guide to Value at Risk (VaR) by EduPristine
What is Value at Risk (VaR)? Introduction Value at Risk (VaR) is a financial metric used to estimate the potential Read More
04, Jul 2024
How to Choose an Institute for the PGP-BAT Program by EduPristine
How to Choose an Institute for the PGP-BAT Program? Hello, and welcome back. It feels great to see you again. Read More
04, Jul 2024
US CPA Eligibility Criteria in India by EduPristine
What is the US CPA Eligibility Criteria in India? Hello, and welcome to our new blog. The ideal accounting candidates Read More
03, Jul 2024
The Cost Involved in Pursuing the ACCA Qualification
What is the Cost Involved in Pursuing the ACCA Qualification? Hello! Welcome back to our new blog. Let me start Read More
18, Jun 2024
Why EduPristine’s Classroom Training Gives PGP-BAT Students a Leading Advantage
Why EduPristine’s Classroom Training Gives PGP-BAT Students a Leading Advantage? Hello, and thank you for being back again. Haven’t we Read More
17, Jun 2024
Why is the FM course gaining popularity in India | EduPristine
Why is the FM course gaining popularity in India? Introduction Hello dear readers, a very warm welcome to all of Read More
14, Jun 2024
Why EduPristine’s Classroom Training Gives ACCA Students a Leading Advantage?
Why EduPristine’s Classroom Training Gives ACCA Students a Leading Advantage? Hello, and welcome to our new blog! If you have Read More
13, Jun 2024
Why is the CFA® course gaining popularity in India | EduPristine
Why is the CFA® course gaining popularity in India? Introduction Hello and welcome back to this brand-new blog where we Read More
04, May 2024
Public Accounting vs. Corporate Accounting by EduPristine
Public Accounting vs. Corporate Accounting: A Comprehensive Comparison Hey there, so good to have you back again. Are you at Read More
02, May 2024
EduPristine: Empowering Tomorrow’s Finance and Accounting Leaders
EduPristine: Empowering Tomorrow's Finance and Accounting Leaders In a world where there is often a gap between what is taught Read More
30, Apr 2024
Understanding Top Finance Skills Employers Value in 2024 | EduPristine
Understanding Top Finance Skills Employers Value in 2024 In the rapidly evolving landscape of finance, the skills demanded by employers Read More
30, Apr 2024
The Essential Role of Financial Management and Its Purpose | EduPristine
The Essential Role of Financial Management and Its Purpose Hey there, so good to have you back again. Have you Read More
25, Apr 2024
What is Financial Reporting and Why is it Important | EduPristine
What is Financial Reporting and Why is it Important? Hey there, so good to have you back again. Have you Read More
24, Apr 2024
Mastering the Foundations of Accounting by EduPristine
Mastering the Foundations of Accounting Hey there, so good to have you back again! Have you ever wondered what lies Read More
23, Apr 2024
All about Credit Risk: A Comprehensive Guide by EduPristine
All about Credit Risk: A Comprehensive Guide In the domain of finance, managing credit risk is pivotal for the stability Read More
22, Apr 2024
The Critical Role of Performance Management | EduPristine
The Critical Role of Performance Management Hey there, so good to have you back again! Have you ever wondered why Read More
18, Apr 2024
A Comprehensive Comparison of Power BI and Excel | EduPristine
A Comprehensive Comparison of Power BI and Excel Hey there, welcome back again! In today's data-driven world, the ability to Read More
15, Apr 2024
CMA vs MBA: Choosing the Right Path for Your Career Growth
CMA Programa vs. MBA: Choosing the Right Path for Your Career Growth Hey there, so good to have you back Read More
13, Apr 2024
Corporate Governance: A Comprehensive Guide by EduPristine
Corporate Governance: A Comprehensive Guide Welcome to our exploration of Corporate Governance! In this blog, we will delve into the Read More
12, Apr 2024
A Guide to Mastering Payroll Management by EduPristine
Mastering Payroll Management: A Comprehensive Guide to Components, Compliance, and Accounting Entries Hey there, welcome back to our new blog. Read More
11, Apr 2024
Data Analytics for Management Accountants – EduPristine
Data Analytics for Management Accountants Why Data Analytics Matter for Management Accountants Hey there, so good to have you back Read More
09, Apr 2024
Investment Valuation: A Comprehensive Guide by EduPristine
Investment Valuation: A Comprehensive Guide Welcome to our comprehensive guide on investment valuation! In this blog, we'll break down the Read More
08, Apr 2024
Mastering MS Excel: Empowering Accountants for Success | EduPristine
Mastering MS Excel: Empowering Accountants for Success. Hey there, welcome back to our new blog. In the intricate world of Read More
05, Apr 2024
Different Payment Methods for Merger & Acquisition | EduPristine
Different Payment Methods for Merger & Acquisition In the ever-evolving landscape of business, Mergers and Acquisitions (M&A) stand as pivotal Read More
04, Apr 2024
Internal vs External Financial Reporting by EduPristine
Internal vs External Financial Reporting Financial reporting is a critical aspect of any organization's communication strategy, serving as a bridge Read More
03, Apr 2024
Difference Between Equity Funds and Mutual Funds by EduPristine
Understanding the Difference Between Equity and Mutual Funds Equity investment and mutual fund investment are both popular choices for long-term Read More
02, Apr 2024
Navigating the ACCA Career Landscape with EduPristine
Navigating the ACCA Career Landscape: Opportunities in India and Beyond Hey there, so good to have you back again! In Read More
01, Apr 2024
Chief Financial Officer (CFO): A Complete Guide | EduPristine
Chief Financial Officer (CFO): A Complete Guide In the dynamic domain of corporate governance, one figure stands out as the Read More
31, Mar 2024
All About Merger and Acquisition by EduPristine
Merger and Acquisition (M&A)? Its What, Why, and When What is M&A? When people hear that a company has taken Read More
31, Mar 2024
What is Income Tax? Part Two by EduPristine
What is Income Tax? Part Two Income tax stands as a pillar of India's economic framework, shaping financial dynamics and Read More
30, Mar 2024
Understanding the Basics of Direct Taxation with EduPristine
Understanding the Basics of Direct Taxation Hey there, so good to have you back again! In the realm of accounting, Read More
30, Mar 2024
The Crucial Role of Ethics in Management Accounting | EduPristine
The Crucial Role of Ethics in Management Accounting Hey there so good to have you back again! Have you ever Read More
29, Mar 2024
What is Income Tax? Part one by EduPristine
What is Income Tax? Part One Income tax serves as a cornerstone in India's financial landscape, wielding significant influence over Read More
29, Mar 2024
Financial Reporting vs. Financial Accounting by EduPristine
Financial Reporting vs. Financial Accounting: Understanding the Basics In the world of business and finance, two key terms often come Read More
28, Mar 2024
How Do Firms Manage Financial Risk | EduPristine
How Do Firms Manage Financial Risk? Managing financial risk is a crucial responsibility for firms in today's dynamic business landscape. Read More
28, Mar 2024
Financial Accounting and Types of Financial Statements | EduPristine
What is Financial Accounting? Exploring Types of Financial Statements Welcome to our exploration of Financial Accounting, a fundamental pillar of Read More
27, Mar 2024
Managerial Accounting- Its Meaning, Process and Types | EduPristine
What is Managerial Accounting? Its Meaning, Process and Types Hello and welcome to the world of managerial accounting—a practical and Read More
27, Mar 2024
A Guide on Project Finance by EduPristine
A Guide on Project Finance In the dynamic landscape of finance, where innovation and strategic thinking converge, one area that Read More
26, Mar 2024
Why do Finance Professionals use Power BI | EduPristine
Why do Finance Professionals use Power BI? Hey there, so good to have you back again! Have you ever found Read More
25, Mar 2024
Macroeconomics: Meaning, Process, and Indicators | EduPristine
Macroeconomics: Meaning, Process, and Indicators Welcome back, students! Today, we're delving into the world of macroeconomics. In this blog, we'll Read More
23, Mar 2024
Internal Audit- Meaning, Objectives, Types and Importance by EduPristine
Internal Audit- Meaning, Objectives, Types and Importance In the world of business, where things can get pretty complex, there's a Read More
22, Mar 2024
A Simple Guide on Quantitative Analysis- EduPristine
What is Quantitative Analysis? A Simple Guide In the ever-changing world of finance, where data holds immense power and decisions Read More
22, Mar 2024
Five Basic Principles of Accounting by EduPristine
What are the Five Basic Principles of Accounting? In the world of finance and business, accounting stands as the backbone, Read More
21, Mar 2024
Internal Controls: Meaning, Types, and Importance by EduPristine
Internal Controls: Meaning, Types, and Importance In the domain of business management, Internal Controls stand as the silent guardians ensuring Read More
21, Mar 2024
Basics of Accounting – Meaning and Basics Concepts | EduPristine
Basics of Accounting - Meaning and Basics Concepts Welcome to the world of Accounting 101 - where numbers tell a Read More
20, Mar 2024
The Different Business Functions by EduPristine
What are the Different Business Functions? In the dynamic landscape of commerce, businesses are intricate entities composed of various interconnected Read More
20, Mar 2024
The Different Types of Business Structures | EduPristine
What are Different Types of Business Structures? In the ever-evolving world of business, the key to sustained success goes beyond Read More
01, Mar 2024
The Vital Role of Cost Management for US-CMAs | EduPristine
The Vital Role of Cost Management for US-CMAs Hey there, so good to have you back again. Have you ever Read More
16, Feb 2024
Role of Ethics and Professionalism in the Investment Industry
Role of Ethics and Professionalism in the Investment Industry In the dynamic landscape of the investment industry, where fortunes are Read More
13, Feb 2024
The Risk Management Process: Essential Steps | EduPristine
The Risk Management Process: Essential Steps In the dynamic landscape of business and finance, uncertainties are inevitable. Every decision, venture, Read More
07, Feb 2024
ACCA vs CPA: Choosing the Right Path for Your Career | EduPristine
ACCA Certification vs. CPA Course: Choosing the Right Path for Your Career Embarking on a career in accounting opens a Read More
05, Feb 2024
Transforming Aspirations into Achievements: CPA Course Excellence
CPA Course Excellence: How EduPristine's Approach Transforms Aspirations into Achievements Embarking on the journey to become a US Certified Public Read More
02, Feb 2024
Comprehensive Guide to ACCA Certification with EduPristine
Unlocking Global Opportunities: A Comprehensive Guide to ACCA Training in India with EduPristine Welcome to your roadmap for global success Read More
01, Feb 2024
CPA Course Decoded: Achieve Success with EduPristine Training
CPA Course Decoded: Achieve Success with EduPristine's Expert-Led Training Embarking on the journey to become a US Certified Public Accountant Read More
31, Jan 2024
US CMA Course: A Step-by-Step Preparation Guide by EduPristine
Master the US CMA Course: A Step-by-Step Preparation Guide by EduPristine Hey there future US CMAs! If you're thinking about Read More
27, Sep 2023
Key Reasons Why Upskilling is Important
As we navigate the challenging yet exciting journey of studying finance and accounting, we wanted to share some valuable advice Read More
27, Jun 2023
All About Evolving Aviation Industry
India’s aviation industry has witnessed significant transformations in recent years, with the emergence of low-cost carriers, the expansion of domestic Read More
16, Jun 2023
How India’s Digital Payment Revolution is Reshaping the Economy
Hey there! So good to have you back again. In this blog, we will discuss the recent developments, explore the significance, Read More
14, Jun 2023
Understand the catastrophic impact of a possible US Debt Default
Hello there! Welcome to our new blog. In this blog post, we will explore the potential catastrophic effects of a Read More
06, Jun 2023
RBI Bids Farewell to Rs. 2000 Notes
Hello there! Welcome to our new blog. In this blog, we will explore the recent decision by the Reserve Bank Read More
25, Apr 2023
Key Insights from the Economic Survey 2022-2023
Hello there, students! How have you been? Today, we will explore more about the recent economic survey, 2022-2023. Economics Read More
25, Apr 2023
What is Digital Marketing? What is the objective?
Hey there! Ever wondered what is the main objective behind practicing digital marketing techniques? Digital marketing has now become a Read More
25, Apr 2023
Why you must consider being a Certified Management Accountant
Hey there! So good to have you back again. Are you someone who loves planning, analyzing, and adjusting monthly Read More
24, Feb 2023
Key Insights from the Economic Survey 2022-2023
Hello there, students! How have you been? Today, we will explore more about the recent economic survey, 2022-2023. Economics plays Read More
14, Feb 2023
What is Digital Marketing? What is the objective?
Hey there! Ever wondered what is the main objective behind practicing digital marketing techniques? Digital marketing has now become a Read More
30, Jan 2023
Why you must consider being a Certified Management Accountant
Hey there! So good to have you back again. Are you someone who loves planning, analyzing, and adjusting monthly budgets? Read More
28, Jan 2023
All About Classroom Training vs Online Training
Hello there, students! How have you been? Today, we will explore more about the recent economic survey, 2022-2023. Economics plays Read More
03, Jan 2023
All About Axis-Citi Acquisition
A significant move initiated by Axis Bank, India’s third largest private sector lender, to acquire Citibank’s retail business has become Read More
28, Dec 2022
Can vernacular edtech ever become mainstream?
Hey there! Glad to have you back again. Did you know that with the next half billion students coming from Read More
26, Dec 2022
Indian start-ups need to start taking corporate governance seriously, why?
Hey there! Glad to have you back again. Wondering why Indian start-ups require corporate governance? If yes, then this blog Read More
22, Nov 2022
How to Level up the Overall Digital Marketing Strategy?
Hello there! So good to have you back. Did you know that more than half of the brands today either Read More
19, Nov 2022
Snapchat for Business
Hey there! Welcome back again. In this blog, we will understand how to use Snapchat for businesses to stand out Read More
18, Nov 2022
What will Digital Marketing Look like in the Next 20 years?
Hey there! Do you wonder what digital marketing will look like in the next 20 years? If yes, then this Read More
17, Nov 2022
Importance of Soft Skills
Hey there! So good to have you back again. In this blog, we will understand the top 5 skills and Read More
15, Nov 2022
Why are Mr. Men and Little Miss characters all over the social media?
Hey there! Welcome back again. If you’re on social media, you must have probably come across Mr. Men and Little Read More
14, Nov 2022
How global firms are looking at the Indian investment market
Hey there! So good to have you back again. Wondering, how the global firms are looking at the Indian investment Read More
14, Sep 2022
Role of Keywords in Digital Marketing
Hey there! Welcome back again. Did you know that a proper keyword search lies at the heart of a successful Read More
13, Sep 2022
All About the Social Media Careers and the Skills to be Mastered
Hey there! Happy to have you back again. Did you know that social media careers are taking off? Well, social Read More
12, Sep 2022
All About Leadership in a Multicultural World
Hey there! Welcome back again. Ever wondered what a global mindset is? If yes, then this blog is a must-read Read More
30, Aug 2022
All about Metaverse and why is metaverse important for brands?
Hey there! Welcome back again. Wondering what exactly Metaverse is? Is it a video game? Or is it just another Read More
26, Aug 2022
Why will the Netflix business model need more than just a quick fix?
Hey there! So good to have you back again! Wondering why the Netflix model will take more than just a Read More
25, Jul 2022
Financial Models and How to Create them Effectively
Hey there! So good to have you back again. In this blog, we will understand how Finance Professionals can create Read More
22, Jul 2022
Top 5 Digital Marketing Trends to be Followed
Hey there! So good to have you back again. Wondering what marketers have been doing so far in 2022? If Read More
19, Jul 2022
Best Practices for Financial Management
Hey there! So good to have you back again. In this blog, we will discuss a few essential tips for Read More
13, Jul 2022
How did the crisis in Sri Lanka impact India?
Hey there! Welcome back again. In this blog, we will discuss how the crisis in Sri Lanka is impacting India. Read More
27, Jun 2022
Objectives of Risk Management
Hey there! So good to have you back again. In this blog, we will answer the most frequently asked question, Read More
10, May 2022
Career Options After Qualifying for the US CMA Course
Hey there! So good to have you back again. Are you curious and want to learn more about the job Read More
07, May 2022
Skills That Make You Proficient in Digital Marketing
Did you know that digital marketing is a dream job for many people today? Let us find out why? If you are Read More
05, May 2022
What Are The Different Types of Financial Markets?
Hey there! Welcome back once again. In the last few blogs, we discussed the financial markets and their functions. We Read More
03, May 2022
How Indian Students Can Pursue the US CPA?
Hey there! So good to have you back again! Are you also wondering how can Indian students acquire the international Read More
02, May 2022
Equity Derivatives and Benefits of Equity Derivatives
Hey there! Welcome back again. Ever wondered what are Equity Derivatives? If yes, then this blog is a must-read. Equity Read More
29, Apr 2022
What are Black Swans in Risk Management?
Hey there! So good to have you back again. Are you wondering what the term “Black Swans” in risk management Read More
28, Apr 2022
Will Digital Marketing Replace Traditional Marketing?
Hey there! Welcome back again. One of the most frequently asked questions we often get is, will digital marketing ever Read More
27, Apr 2022
Functions of Financial Markets?
Hey there! Welcome back to another blog on finance. In the previous blog, we discussed what are financial markets and Read More
26, Apr 2022
How to Calculate GST (Goods and Services Tax)?
Hey there! So good to have you back again. Are you also keen on learning how to calculate GST? If Read More
25, Apr 2022
Why are Financial Markets Regulated?
Hey there! Welcome back again. Are you also curious and wondering why are financial markets regulated and why are they Read More
22, Apr 2022
Does an Accountant Need an MBA?
Hey there! Welcome back again. Are you the one among others who is confused and want to know whether an Read More
21, Apr 2022
Why is ACCA Not Recognized in The USA?
Hey there! Welcome back again. Have you ever wondered why is the ACCA course not recognized in the USA, but US CPA Read More
20, Apr 2022
Is the US CMA Course Appropriate for Working Professionals?
Hey there! Are you a working professional and want to pursue the US CMA course simultaneously while working full time? If yes, Read More
19, Apr 2022
What is a Derivative?
Derivatives are financial contracts that derive their value from the performance of an underlying asset, or group of assets, or Read More
18, Apr 2022
What is Derivative Market?
Did you know that derivatives are also considered advanced investing? Well, derivatives can be called secondary securities whose value is Read More
16, Apr 2022
Types of Acquisitions
Hey there! Welcome back once again. Have you ever wondered why do many acquisitions succeed just as many who fail? Read More
15, Apr 2022
Types of Mergers
Hey there! Welcome back again. In the previous blog, we discussed what are mergers and acquisitions. In this blog, we Read More
14, Apr 2022
What are Mergers and Acquisition?
Hey there! Welcome back again. Mergers and Acquisition sound quite familiar right? But ever wondered why are Mergers and Acquisitions Read More
12, Apr 2022
Do Indian Companies Hire CFA’s?
Hey there! So good to have you back again. Are you planning to do CFA and wondering whether Indian companies Read More
11, Apr 2022
What Should I Study, US CMA or Digital Marketing?
Hey there! Welcome back again. Are you confused and wondering which course to study, US CMA or Digital Marketing? Well, Read More
08, Apr 2022
Types or Methods of Business Valuation
Hey there, Welcome back again. Let us understand what business valuation is and its different methods. Let us get started. Read More
07, Apr 2022
What is GST? What Are The Career Opportunities in GST (Tax domain)?
The tax system in India has undergone tremendous changes since the introduction of GST. GST stands for Goods and Services Read More
16, Feb 2022
How to Manage Risks in a Business?
Hey there! Welcome back again. Do you know one of the most critical factors to be kept in mind while Read More
15, Feb 2022
How to Work On a Digital Marketing Project for Practice?
Hey there! Welcome back to another blog. We will be discussing the tips on how to work on a digital Read More
13, Feb 2022
What is Digital Marketing? What is the objective?
Hey there! Ever wondered what is the main objective behind practicing digital marketing techniques? Digital marketing has now become a Read More
12, Feb 2022
Is CA the only optimal career option for commerce graduates?
Are you also thinking about what is next after B.Com? Is pursuing CA the only option for commerce graduates? Let Read More
11, Feb 2022
All about the US CPA course
Topic: Is CPA preferable after CA? Are you a qualified Chartered Accountant and wondering what is next after CA? If Read More
10, Feb 2022
In your opinion, what makes a good Financial Model?
Are you aware that a good financial model can help multiple start-ups and small businesses? With this, now let us Read More
09, Feb 2022
What is Business Valuation?
Business valuation is the general process or result of determining the economic value of a company or a whole business or Read More
08, Feb 2022
Does CFA has any scope in India?
Is it worth becoming a CFA (Chartered Financial Analyst)? Is it worth investing nearly three years, spending about 900 study hours, and Read More
07, Feb 2022
Career Advice: Is doing the ACCA over a CA a better option?
Hey there! So good to have you back again. This blog is mainly for those who are confused regarding which Read More
04, Feb 2022
Which is a Better Career Option, CFA or FRM?
Hey there! Welcome to another blog where we discuss which course is better, the CFA course or the FRM course? We will be Read More
02, Feb 2022
What is the procedure for enrolment for the CPA program for beginners?
Hey there! So good to have you back again. Well, if you are planning to pursue the CPA course then Read More
01, Feb 2022
How Do People Judge the Quality of Financial Modeling?
Hey there! Welcome back again. Are you also wondering what is Financial Modeling, that everyone in the finance industry keeps talking Read More
17, Jan 2022
What is the Reality of a Career in Digital Marketing?
Hey there! Welcome back again. Do you wish to get better clarity on what is the actual reality of a Read More
14, Jan 2022
Which is Better CMA or CIMA?
CMA and CIMA sound quite similar right? Are they the same? Are you also confused and wondering which one is Read More
13, Jan 2022
Is CFA in India Good for a Career?
Hey there! Welcome back again. Are you thinking about how good is the CFA as a career option in India? Let’s deep Read More
12, Jan 2022
I Desire to Get an ACCA Degree, but the Tuition is too Expensive. Why is the ACCA Course Expensive?
Hey there! So good to have you back again. Today, we will be answering the most frequent question which is, Read More
11, Jan 2022
Are There Any Job-Oriented Courses After Completing Graduation?
Hey there! Congratulations on completing your graduation. Are you now ready and excited to pursue job-oriented courses that will help you secure Read More
10, Jan 2022
Is Financial Modeling from EduPristine Worth It?
Hey there! Welcome back again. Let me begin by asking you a very simple question which is, did you know Read More
07, Jan 2022
Does Digital Marketing Have a Great Future Ahead?
Why Digital Marketing course is trending and has so much demand? What topics are covered under the Digital Marketing course syllabus? Is Digital Marketing Read More
06, Jan 2022
What are the Benefits of Pursuing FRM Course(GARP)?
You must have heard about the term FRM or Financial Risk Manager several times, but ever wondered what exactly is FRM, how Read More
05, Jan 2022
What is the Syllabus for CPA Course? Is it the Same as CA or Different?
Hello there! Welcome back again. Are your curious minds also wondering whether the syllabus for the US CPA course is similar to Read More
04, Jan 2022
What are The Top Skills a Commerce Student Must Have?
Hey there! So good to have you back again. Did you know companies are more inclined towards selecting candidates who Read More
03, Jan 2022
What are the Benefits of Learning Financial Modeling?
Do you ever wonder what does a Financial Modeler do? Some of you might also want to become a successful Read More
21, Oct 2021
What is the difference between ACCA and CPA?
Accounting is a field that has endless job opportunities. It is the backbone of an organization. Be it any industry, Read More
21, Sep 2021
5 Reasons why you should pursue the CPA course after CA
CPA course, also known as Certified Public Accountant (CPA), is a globally recognized designation and is the highest standard of Read More
21, Oct 2020
How Opting for Full-Time Level I CFA Course Gives You an Edge Over Others
Chartered Financial Analyst (CFA course) is one of the most in-demand certifications in the field of finance and provides lucrative Read More
22, Aug 2020
A Complete Guide on ACCA Course Eligibility, Duration, Registration, Fees, Etc.
Why the ACCA course? ACCA is a global professional accounting body offering the Chartered Certified Accountant qualification (ACCA) and is Read More
17, Aug 2020
CPA Exam Registrations and Scheduling in India
CPA Exam Registration CPA stands for Certified Public Accountant and is one of the major certification courses in the field Read More
18, May 2020
What is Soft Skill Training ?
What is Soft Skill Training With the evolution of the business and client servicing industry, soft skills have started gaining Read More
03, Oct 2019
What is Finance: Types of Finance and Financial Instruments?
Finance is a major and vast topic to cover. Accounting and Finance are often used together, and some even deem Read More
10, Sep 2019
All you want to know about Chartered Accountant (CA)
Here's what you need to get started with the Chartered Accountant (CA) course Chartered Accountant is an honorable designation that Read More
03, Jul 2019
Soft Skills For The Hard World
Soft Skills Training - Reality Check: Whether we'™re talking in a team meeting or presenting in front of an audience, Read More
26, May 2019
What is the Importance Of Relative Valuation
Relative Valuation Generally speaking, ‘valuation’ can be defined as the process for finding the ‘value’ of anything. In the world Read More
19, May 2019
Ratio Analysis – Ratios Formulae
Ratio analysis'”the foundation of fundamental analysis'”helps to gain a deeper insight into the financial health and the current and probable Read More
20, Apr 2019
Excel Tricks: Text Functions in Excel
How to use Text Functions in Excel Excel is mostly about the numerical data, but at times you can Read More
10, Apr 2019
Explore the Top 12 Opportunities Which Will Take Your Career to the Next Levet [2020 – 2021]]
While writing the last paper of your final B.Com exam, a plethora of thoughts go through your mind. A lot Read More
28, Oct 2018
Top 10 Accounting Firms
Over the years, the way of doing business has changed significantly. There are a number of factors which have contributed Read More
10, Oct 2018
Everything you want to know about the CMA certification
CMA Full Form: Certified Management Accountant (CMA) Going for the CMA certification is a great career move, especially when you Read More
06, Aug 2018
SAP certification – examination, eligibility and benefits
SAP certification help validate the expertise and experience of SAP partners, software users, customers and professionals who are looking to Read More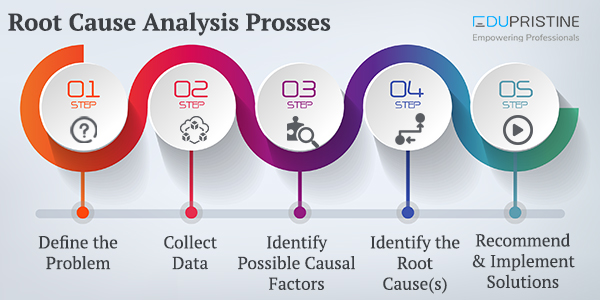
03, Aug 2018
Root Cause Analysis
As the name suggests, Root Cause Analysis deals with identifying the origin of a problem and finding a solution for Read More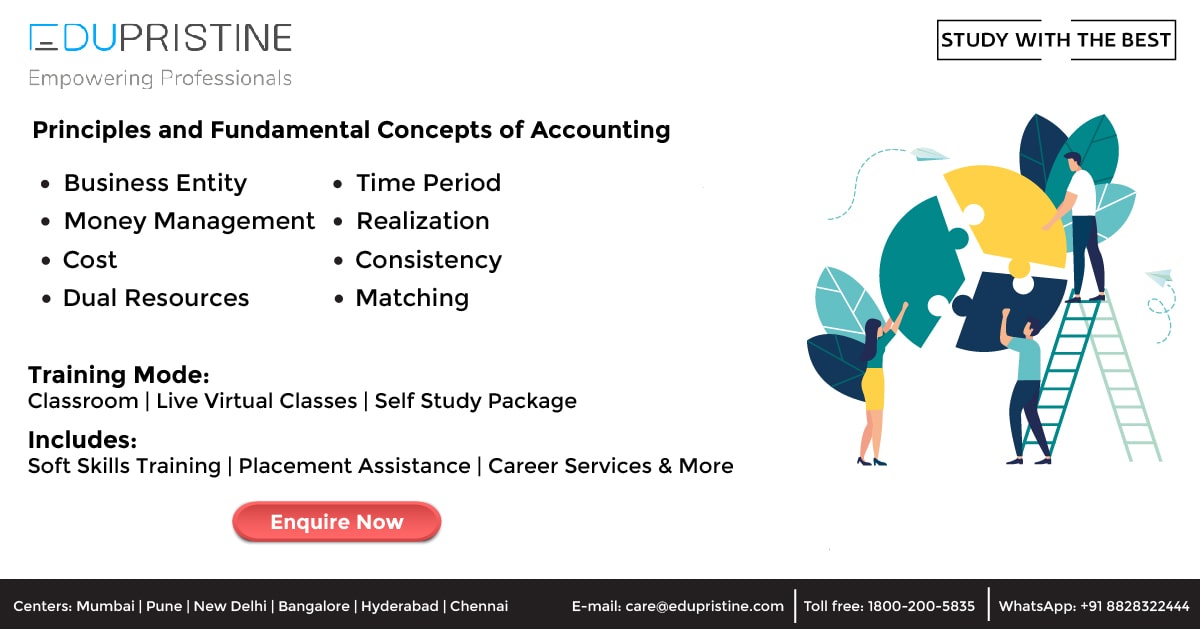
26, Jun 2018
Principles and Fundamental Concepts of Basic accounting
Accounting is extremely popular as the language of business language. Through this language, it is easy to analyze the financial Read More
04, Jun 2018
Know how to understand and interpret cash flow statement
A cash flow statement is essential to any business as it can be the basis of budgeting by assessing the Read More
29, Mar 2018
ALL YOU WANT TO KNOW ABOUT SENSITIVITY ANALYSIS
The Crucial Role of Sensitivity Analysis: Hey there, so good to have you back again. Have you ever wondered how Read More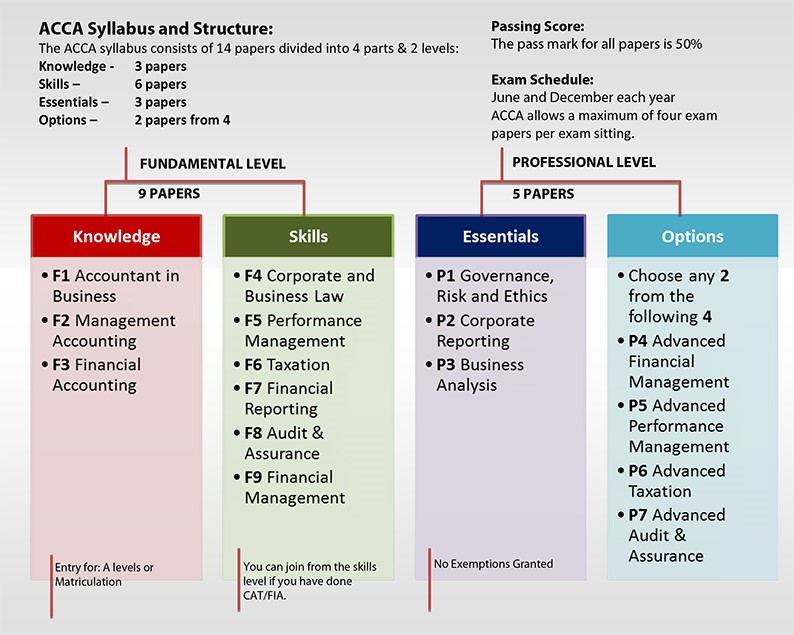
24, Mar 2018
ACCA Full Form
ACCA - Association of Chartered Certified Accountants The role of strategic academic guidance in the life of a student is Read More
25, Feb 2018
FINDING AND REMOVING DUPLICATES IN EXCEL
FINDING AND REMOVING DUPLICATES IN EXCEL Have you ever encountered a situation where you see a lot of duplicated data Read More
07, Feb 2018
Capital Budgeting: Techniques & Importance
In our last article, we talked about the Basics of Capital Budgeting, which covered the meaning, features and Capital Budgeting Read More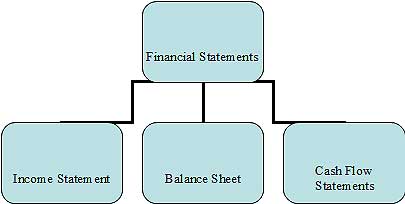
14, Jan 2018
Importance of Business Accounting for enterprises
Introduction: Importance of Accounting to your business The term Accounting is a very common one and we hear about the Read More
11, Jan 2018
Amalgamation Explained in detail
AMALGAMATION EXPLAINED IN DETAIL Understanding Amalgamation: Exploring the Dynamics of Corporate Unions Have you ever wondered what truly defines the Read More
08, Jan 2018
Working Capital Management
What is Working Capital Management? Traditionally, investors, creditors and bankers have considered working capital as a critical element to watch, Read More
30, Dec 2017
STATISTICAL FUNCTIONS IN EXCEL
STATISTICAL FUNCTIONS IN EXCEL People usually have love-hate relationship with statistics. When you get your formulas right you are in Read More
07, Dec 2017
Venture Capital
Unlocking the power of Venture Capital: Features, Financing Methods, and Opportunities Hey there, so good to have you back again! Read More
02, Dec 2017
Financial Reporting
In any industry, whether manufacturing or service, we have multiple departments, which function day in day out to achieve organizational Read More
09, Nov 2017
Cell References in Excel
While using excel, there may be times when you want to keep the values same while copying formulas. This can Read More
24, Sep 2017
Costing Methods & Important Cost Terms
Costs can be simply defined as the money or resources associated with a purchase / business transaction or any other Read More
25, Aug 2017
Balance sheet explained in detail
What is Balance Sheet? A balance sheet (also called the statement of financial position), can be defined as a statement Read More
15, Jul 2017
Cash Flow Statement
CASH IS KING;is a known fact, that it is the basis of any business. No bills, employees or for that Read More
08, Jul 2017
What are the career options after Mcom
Master of Commerce or M Com is a postgraduate Master Degree which specializes in commerce, accounting, management and economics related Read More
07, Jun 2017
WHAT IS STANDARD DEVIATION?
WHAT IS STANDARD DEVIATION? In finance and investment, understanding and managing risk is of paramount importance. Among the tools available Read More
21, Apr 2017
Know how effective is CMA course compared to MBA in providing a dream job
There are various industries and sectors out there where you can grow and enhance your career. Management, Accounting, Finance, Engineering, Read More
02, Mar 2017
ACCA EXAM STRUCTURE AND PATTERN
ACCA EXAM STRUCTURE AND PATTERN Understanding the ACCA exam structure and pattern is essential for individuals aspiring to pursue a Read More
22, Feb 2017
Comparison of CPA course with other courses
The Accounting industry offers you various opportunities to learn via various courses. You can choose which one suits your academic Read More
08, Feb 2017
Advantages and Application Process of FRM
FRM (Financial Risk Manager) Certification gives you a distinctive edge from the other risk management professionals operating in the Finance Read More
03, Jan 2017
An insight into OTC Derivatives
What is Derivatives? Derivatives are defined as the type of security in which the price of the security depends/is derived Read More
03, Oct 2016
CPA Course Syllabus – Topics and Importance
A CPA requires a broad spectrum of knowledge and proficiency in it. The purpose of CPA exam syllabus is to Read More
07, Jun 2016
CFA® Study Planner
Most of the CFA® pursuers believe that CFA® Program tests are very difficult and arduous but that is not the Read More
03, Jun 2016
CPA Course details, application fees and benefits of doing it
A Certified Public Accountant (CPA) is the highest standard of competence in the field of Accountancy across the globe. The Read More
31, May 2016
All Important About CFA® LEVEL 1 Syllabus
CFA® charter is one of the most exalted credentials of those who work in the financial sector or who make Read More
18, Jan 2016
All about Portfolio Management
What is a Portfolio? A portfolio can be defined as different investments tools namely stocks, shares, mutual funds, bonds, cash Read More
25, Nov 2015
Cost Management: Meaning, Techniques & Advantages
What is Cost? Cost is defined as the monetary valuation of effort, material, resources, time consumed, risk and opportunity forgone Read More
19, Oct 2015
How to get into Big 4 Accounting Firms?
We all have some career objectives and aspirations. For higher studies like MBA, CA, CPA, ACCA, CFA etc. one has Read More
13, Oct 2015
FRM Question Bank
For every exam, time management is very important and everyone wants a precise course content in a prioritized manner along Read More
29, Sep 2015
Top 10 Companies that hire CFA® Charterholders
A lot of hardwork and investment is required to prefix the words CFA® Program before your name and time and Read More
18, Aug 2015
Income Statement in detail
WHAT IS INCOME STATEMENT? The income statement is one of the important primary financial statements provided by organizations. It presents Read More
12, Aug 2015
KPIs for Business Analysts
A business analyst's role in an IT project is to ensure that all requirements of the client are captured and Read More
03, Aug 2015
Annual Report
What is an Annual Report: The single source of getting information about any company whether it is the past or Read More
01, Jul 2015
Capital Budgeting
WHAT IS CAPITAL BUDGETING? Capital budgeting is a company’s formal process used for evaluating potential expenditures or investments that are Read More
16, Jun 2015
Mergers and Acquisitions
What is Mergers & Acquisitions? Mergers and acquisitions (M&A) are defined as consolidation of companies. Differentiating the two terms, Mergers Read More
15, Jun 2015
Detecting Multicollinearity
" In my previous blog “ How to deal with Multicollinearity ”, I theoretically discussed about definition of multicollinearity and Read More
26, May 2015
ANALYSIS OF FINANCIAL STATEMENT OF A COMPANY
ANALYSIS OF FINANCIAL STATEMENT OF A COMPANY One of the major aspects of making a sound investment decision is analyzing Read More
24, Mar 2015
8 Excel functions that every Data Analyst must know
Are you a data analyst or looking for a career as a data analyst??? Well then, today's article is dedicated Read More
24, Mar 2015
Duckworth-Lewis Method
Duckworth-Lewis method(D/L method) is a mathematical function defined to set and calculate the target score for the team batting second Read More
28, Feb 2015
6 Most Common Excel Errors
Hashtags look cool when seen on Twitter or Facebook but as soon as they start appearing in Excel sheet, you Read More
23, Feb 2015
RULE PRECEDENCE IN CONDITIONAL FORMATTING
RULE PRECEDENCE IN CONDITIONAL FORMATTING Conditional Formatting in Excel makes tasks easier and more user-friendly but it can sometimes be Read More
10, Dec 2014
Types of Investment Banking jobs
Investment banking is one of the most attractive industry to work in. not only for people with formal education in Read More
29, Aug 2014
FRM Part 1 syllabus
Shut your doors, drop the drapes on your windows and don't bother looking at the clock because it's always the Read More
20, Aug 2014
Ratio Analysis – Introduction
Introduction The term 'ratio analysis'refers to the analysis of the financial statements in conjunction with the interpretations of financial results Read More
20, Aug 2014
Ratio Analysis – Classification of ratios and Liquidity Ratio
In our previous blog post we discussed ratio analysis. In this blog post we will explain classification of ratios and Read More
23, May 2014
Bootstrapping Solution
What is the Bootstrapping method? Bootstrapping is a method for constructing a zero-coupon yield curve from the prices of a Read More
13, Nov 2013
Dell’s Leveraged Buyout: A Real-life Case Study
Acquisitions Acquisitions or takeovers are a transaction or process wherein one company (commonly called as acquirer) or an investor acquires Read More
08, Aug 2013
CASH FLOW STATEMENT: LEARN TO CREATE CASH FLOW STATEMENT TEMPLATE IN EXCEL
CASH FLOW STATEMENT: LEARN TO CREATE CASH FLOW STATEMENT TEMPLATE IN EXCEL Welcome to our following how-to guide: How to Read More
07, Feb 2010

Leave a Reply